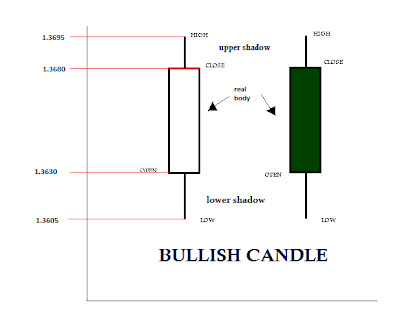
So if your going to trade the forex markets then in my opinion your going to need to look at Japanese Candle Stick Patterns; so what is a candle stick, first off, it's the thing that will tell you the price the market has and is trading at, so lets look at a candle and see what we can learn.
OK, so first of both candles are showing the exact same information so we can use either; I will go with the one on the left, and what we see is that the market opened at 1.3630 and traded as high as 1.3695 and as low as 1.3605 before finally closing at 1.3680. So the price of the candle is moved by the buyers and sellers in the market place so when we see that we have a candle opening at 3630 and then closing at 1.3680 then we know that buyers have won the day as they closed the market at the higher price. We also know this visually as the white or green body is the default setting for a buyer's candle on most charting software. The upper shadow shows how high above the closing price the market traded and the lower shadows represent how much lower than the opening price the market traded for that period, this is important to know (which we can discuss further with I get enough requests to), and is why I give priority to candles over OHLC bars and so forth.
This is known as a bullish candle indicating that the market was rising for that period. The period in question would also depend on the timeframe for that chart, so if we look at a daily chart then each candle would represent one 24hr period of trading, where as on a 60 min chart, 1 candle would represent 1hr's worth of trading.
That was a bullish candle and now we look at a bearish candle.
OK, so using the first candle on the left, we have a market that has opened at 1.3680 and traded as high as 1.3695 and as low as 1.3605 before finally closing at 1.3630. So using the same logic as the last candle this time we can see the sellers have closed the market down from its open 3680 to close at 3630 so this time we know that the sellers have won the day as they closed the market at the lower price. We also know this visually as the black or red body is the default setting for a buyer's candle on most charting software. The upper shadow shows how high above the opening price the market traded and the lower shadows represent how much lower than the closing price the market traded for that period, again this is important to know (which we can discuss further with I get enough requests to).
This is known as a bearish candle indicating that the market has fallen for that day if we were looking at a daily chart and so forth.
So I hope this helps, it is only the start I will cover more as we go on, till then feel free to drop a comment or ask a question and happy pip collecting.
The PipMeister


No comments:
Post a Comment